cryptocurrency price chart,Cryptocurrency Price Chart: A Comprehensive Guide
Cryptocurrency Price Chart: A Comprehensive Guide
Understanding the cryptocurrency market can be daunting, especially when it comes to interpreting price charts. As you delve into the world of digital currencies, it’s crucial to have a solid grasp of how to read and analyze these charts. In this detailed guide, we’ll explore the various aspects of a cryptocurrency price chart, helping you make informed decisions in your investment journey.
Understanding the Basics
A cryptocurrency price chart is a visual representation of the value of a digital currency over a specific period. It typically includes a time frame, price, and volume of transactions. By examining this chart, you can gain insights into the market’s behavior and predict future price movements.
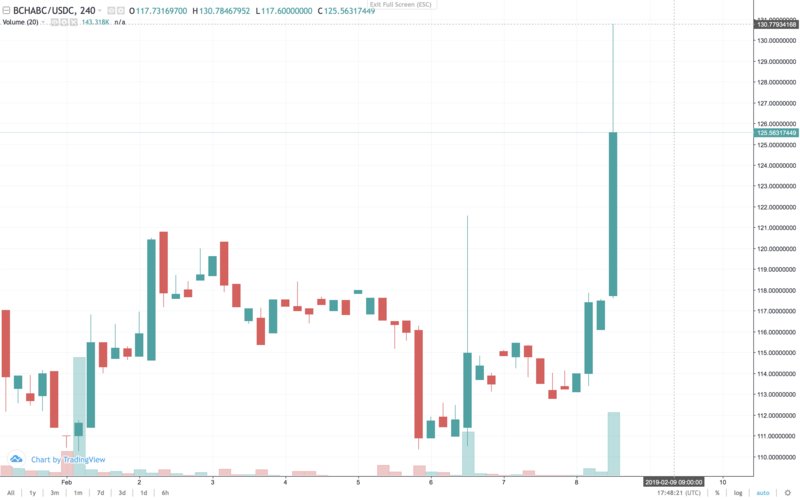
Let’s start by breaking down the key components of a cryptocurrency price chart:
- Time Frame: The time frame refers to the duration over which the price data is displayed. Common time frames include 1 minute, 5 minutes, 30 minutes, 1 hour, 4 hours, 1 day, 1 week, and 1 month. Choosing the right time frame depends on your trading strategy and investment horizon.
- Price: The price is the value of the cryptocurrency at a specific point in time. It’s usually represented by a line or a series of bars on the chart.
- Volume: Volume represents the number of units of a cryptocurrency traded over a given time frame. It’s often displayed as a bar or a histogram on the chart.
Interpreting Price Patterns
Price patterns are recurring formations on a price chart that can indicate potential future price movements. Some common price patterns include:
- Trend Lines: Trend lines connect the highs and lows of a price chart, helping you identify the overall direction of the market. Uptrend lines slope upwards, while downtrend lines slope downwards.
- Support and Resistance: Support and resistance levels are price levels where the market has repeatedly struggled to move below (support) or above (resistance). These levels can indicate potential buying or selling opportunities.
- Head and Shoulders: The head and shoulders pattern is a reversal pattern that indicates a potential change in trend. It consists of three peaks, with the middle peak being the highest and the two outer peaks being similar in height.
- Bullish and Bearish Engulfing: The bullish engulfing pattern occurs when a bearish candle is followed by a bullish candle that engulfs the previous candle. This pattern suggests a potential reversal from bearish to bullish.
Using Technical Indicators
Technical indicators are mathematical tools used to analyze price charts and identify potential trading opportunities. Some popular technical indicators include:
- Relative Strength Index (RSI): The RSI measures the speed and change of price movements, helping you identify overbought or oversold conditions.
- Moving Averages: Moving averages smooth out price data, helping you identify the overall trend and potential entry and exit points.
- Bollinger Bands: Bollinger Bands consist of a middle band, an upper band, and a lower band. These bands help you identify potential overbought or oversold conditions and price volatility.
Reading the News
Staying informed about the latest news and developments in the cryptocurrency market is crucial for making informed decisions. Pay attention to the following factors:

- Regulatory News: Changes in regulations can significantly impact the market, so keep an eye on news related to government policies and regulations.
- Market News: Stay updated on market trends, such as new projects, partnerships, and technological advancements.
- Company News: Keep track of news related to the companies behind the cryptocurrencies you’re interested in, such as earnings reports, product launches, and executive changes.
Conclusion
Reading and interpreting cryptocurrency price charts is a skill that takes time and practice to develop. By understanding the basics, recognizing price patterns, using technical indicators, and staying informed about the latest news, you’ll be better equipped to make informed decisions in the cryptocurrency market. Remember that investing in cryptocurrencies involves risks, so always do your research and consider your risk tolerance before making any investment decisions.